
- By Della tj
- August 11, 2025
- Uncategorized
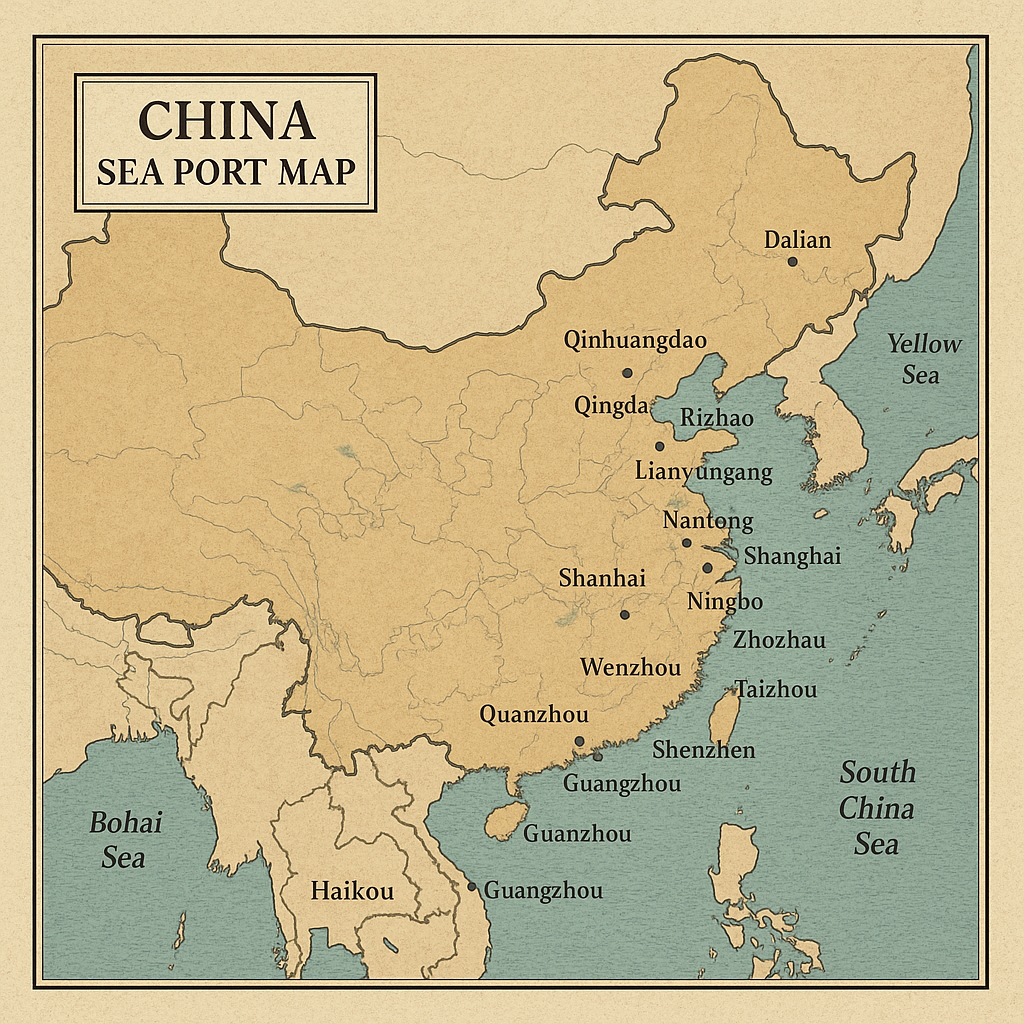
Introduction – Why the China Sea Port Map Matters
When you’re shipping from China, the China sea port map is your navigation guide to global trade. With over 34 major coastal ports, China connects to almost every corner of the world. Choosing the right port affects your transit time, freight rates, and even your cargo’s safety.
1. What Is the China Sea Port Map?
The China sea port map shows the locations of major maritime gateways along China’s east and south coasts. It helps importers and exporters:
- Match suppliers to the nearest port
- Select the fastest shipping routes
- Plan for seasonal and weather-related disruptions
2. Categories of Chinese Sea Ports
Not all ports on the China sea port map are the same. They can be grouped into:
- Container Ports – High-capacity for general goods (Shanghai, Shenzhen, Ningbo)
- Bulk Cargo Ports – Handle raw materials like coal, ore, and grain (Qingdao, Dalian)
- Specialized Ports – Focus on oil, chemicals, or oversized cargo (Tianjin, Rizhao)
- River-Sea Ports – Connected by inland waterways for combined transport (Guangzhou, Nanjing)
3. Major Ports and Their Key Details
China Sea Port Quick Reference Form
| Port Name & Location | Main Cargo Types | Annual Container Volume (Approx.) | Key Advantages |
|---|---|---|---|
| Shanghai Port – Shanghai | Electronics, machinery, consumer goods | 47+ million TEUs | Largest port globally, excellent connectivity |
| Shenzhen Port – Guangdong | Electronics, garments, furniture | 28+ million TEUs | Close to Hong Kong, ideal for exports to US & SE Asia |
| Ningbo-Zhoushan Port – Zhejiang | Bulk, containers, chemicals | 30+ million TEUs | Deep-water harbor, fast clearance |
| Qingdao Port – Shandong | Auto parts, chemicals, agriculture | 23+ million TEUs | Strong Japan, Korea, and Europe routes |
| Guangzhou Port (Nansha) – Guangdong | Industrial goods, perishables | 21+ million TEUs | Central in Pearl River Delta, diverse cargo |
| Tianjin Port – Tianjin | Heavy machinery, steel, bulk | 18+ million TEUs | Gateway for Beijing & northern China |
| Xiamen Port – Fujian | Footwear, stone, small machinery | 11+ million TEUs | Mid-size port with solid regional reach |
| Dalian Port – Liaoning | Oil, chemicals, bulk commodities | 10+ million TEUs | Hub for Northeast Asia trade |
4. Shipping Time, Conditions & Terms
| Destination Region | Avg. Transit Time | Common Incoterms | Seasonal Notes |
|---|---|---|---|
| US West Coast | 14–18 days | FOB, CIF | Peak Aug–Oct |
| US East Coast | 25–30 days | FOB, CFR | Winter storms |
| Europe (North) | 28–35 days | CIF, DDP | Dec congestion |
| Southeast Asia | 4–8 days | FOB, EXW | Typhoon season |
| Middle East | 20–25 days | CFR, CIF | Summer heat |
5. Must-Know Shipping Terms
- FOB – Seller delivers goods on board vessel at origin.
- CIF – Seller covers cost, insurance, freight to destination port.
- DDP – Seller delivers goods to buyer’s premises with duties paid.
- CFR – Seller pays freight but not insurance.
6. Seasonal & Weather Considerations
- Peak Export Season: Aug–Oct – Higher rates & congestion.
- Typhoon Season: Jul–Oct – Disruptions at southern ports.
- Winter Delays: Jan–Feb – Ice & storms at northern ports.
7. Customs & Compliance at Chinese Ports
Efficient shipping depends on meeting both customs and environmental standards:
📍Customs Clearance
- Ensure all documentation (invoice, packing list, bill of lading) is accurate.
- For restricted goods, secure permits before shipping.
- Use experienced customs brokers to minimize inspection delays.
📍Environmental Regulations
- Low-sulfur fuel required in Emission Control Areas.
- Shore power systems allow ships to switch off engines while docked.
- Ports like Shanghai, Ningbo, and Shenzhen are adopting electric cranes and trucks.
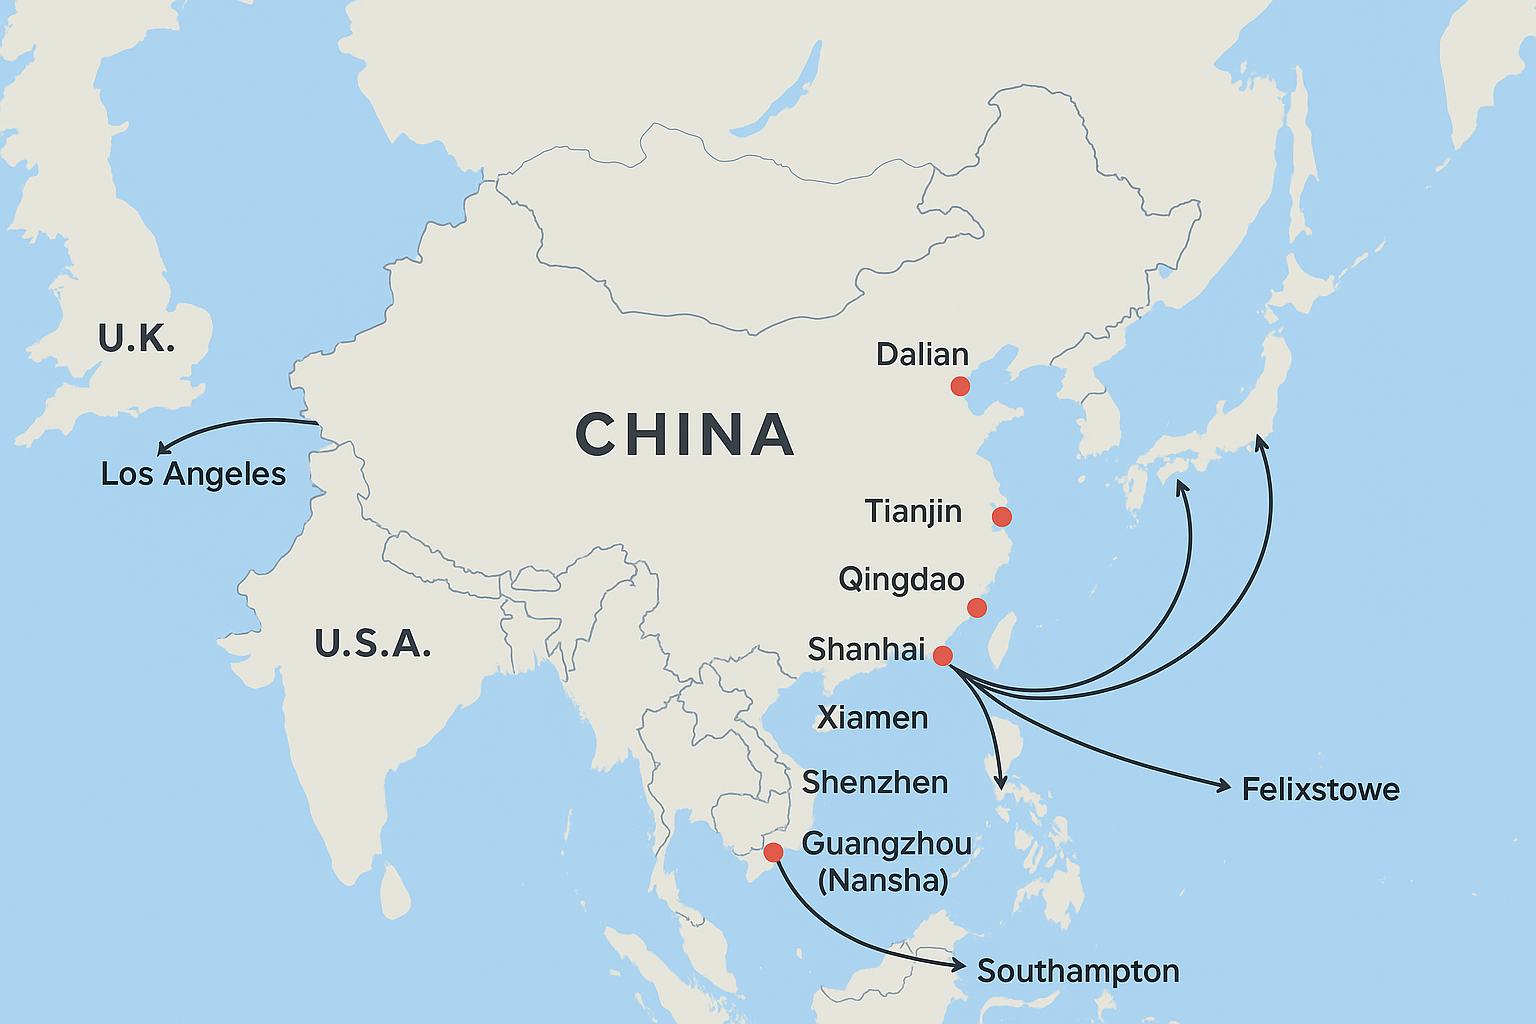
8. Distance & Cost Comparison – China to U.S. & U.K.
| Chinese Port | Destination Port | Sea Distance (Nautical Miles) | Avg. Transit Time | Approx. Cost/40ft Container* |
|---|---|---|---|---|
| Shanghai | Los Angeles, USA | ~5,800 nm | 15–18 days | $2,300–$3,200 |
| Shenzhen | Los Angeles, USA | ~6,200 nm | 16–19 days | $2,400–$3,400 |
| Ningbo-Zhoushan | New York, USA | ~10,500 nm | 28–30 days | $4,000–$5,200 |
| Qingdao | Felixstowe, UK | ~10,800 nm | 30–35 days | $3,800–$5,000 |
| Guangzhou (Nansha) | Southampton, UK | ~11,200 nm | 32–36 days | $4,200–$5,500 |
| Tianjin | Los Angeles, USA | ~6,100 nm | 16–20 days | $2,500–$3,500 |
9. Future Development & Practical Tips
🟢Future Development of Chinese Ports
- Expansion projects in Shanghai, Ningbo, and Guangzhou to increase capacity.
- Greater automation to speed up vessel turnaround and reduce labor costs.
- Improved inland rail-sea connections for better intermodal transport.
🟢Practical Tips for Using the China Sea Port Map
- Verify port codes before booking to avoid documentation errors.
- Compare rates and transit times from different carriers serving the same port.
- Choose ports with direct routes to your target destination to save time.
- Avoid booking close to public holidays or peak export seasons.
10.Conclusion
The China sea port map is an essential tool for anyone moving goods internationally. Understanding port capabilities, seasonal factors, customs procedures, and distance-to-market comparisons helps shippers choose the most cost-effective and time-efficient routes. Whether exporting electronics from Shenzhen or heavy machinery from Tianjin, the right port choice can significantly boost logistics performance.
Request a Quote
Need a tailored solution for your shipping from China?
Let TJ China Freight Forwarder assist you with reliable, cost-effective service.
FAQ:
Q1.Which Chinese port is best for high-volume exports?
Shanghai handles the largest container volume in the world.
Q2.Can I send small shipments through major ports?
Yes, using LCL (Less than Container Load) services.
Q3.Are customs procedures the same at all ports?
Procedures are similar, but clearance speed can vary by location.
Q4.Which port offers the fastest direct route to the U.S.?
Shanghai and Shenzhen to Los Angeles are among the quickest.
Q5.How often should I update my shipping route plan?
At least once a year, or when trade regulations or port capacities change.