
- By TOP CHINA FREIGHT
- September 29, 2025
- Uncategorized
The global shipping market is heavily influenced by the China containerized freight index historical data, which provides valuable insights into pricing trends, logistics efficiency, and supply chain strategies. Many businesses depend on this data to predict costs, plan deliveries, and optimize trade routes. Understanding how the index evolved over time allows shippers, freight forwarders, and importers to anticipate market fluctuations and manage risks effectively.
What is the China Containerized Freight Index?
The China Containerized Freight Index (CCFI) measures the average freight rates for container shipping from major Chinese ports to different global destinations. It serves as a benchmark for the shipping industry by reflecting the cost of moving goods across trade lanes.
The index covers multiple shipping routes including:
- China to Europe
- China to the Mediterranean
- China to North America (East and West Coasts)
- China to Southeast Asia
- China to South America
Because it represents actual freight contracts, it provides a realistic view of shipping costs. The CCFI differs from spot market rates since it accounts for both long-term contracts and short-term fluctuations, making china containerized freight index historical data highly valuable for logistics planning.
Why is Historical Data on CCFI Important?
Historical freight data is not just about looking at past prices. Instead, it reveals how global events impact logistics. For example:
- During 2008–2009, the global financial crisis led to sharp drops in shipping demand.
- In 2020–2021, COVID-19 caused extreme volatility, with freight rates soaring due to port congestion and container shortages.
- Trade policy changes, such as tariffs between China and the USA, also caused fluctuations.
By studying the china containerized freight index historical data, businesses can evaluate long-term shipping cost patterns and anticipate risks. This helps in forecasting budget allocations, negotiating contracts, and adjusting supply chain strategies.
How Has the China Containerized Freight Index Changed Over Time?
The CCFI has experienced cycles of growth and decline. A simplified summary of historical trends is presented below:
| Year | Global Event Impact | Freight Index Trend | Key Insight |
|---|---|---|---|
| 2008 | Financial Crisis | Sharp decline | Oversupply of vessels lowered rates |
| 2010 | Recovery Period | Moderate increase | Trade demand recovered gradually |
| 2015 | Overcapacity Issue | Stable but low | Excess container ships hurt margins |
| 2020 | COVID-19 Pandemic | Surge in rates | Container shortages drove record prices |
| 2022 | Port Congestion | High but volatile | Delays and backlogs maintained high rates |
| 2023–24 | Stabilization | Gradual decline | Market adjusted as demand slowed |
Analyzing this historical container freight index data helps companies prepare for cycles of volatility and stability in the market.
What Factors Influence the CCFI Historical Data?
High demand for exports from China increases rates.
Rising bunker fuel prices push shipping costs higher.
Shortages, like during the pandemic, cause rate spikes.
Longer waiting times at major ports increase costs.
Tariffs and trade restrictions create sudden changes.
Digitalization and efficiency improvements can stabilize rates.
How Can Businesses Use CCFI Historical Data Strategically?
Companies can use CCFI historical records to:
1.Plan Budgets:
Forecast expected shipping costs for upcoming quarters.
2.Negotiate Contracts:
Leverage historical patterns to secure better rates.
3.Diversify Routes:
Adjust logistics strategies to avoid volatile trade lanes.
4.Mitigate Risks:
Use data to anticipate peak seasons and avoid costly delays.
Moreover, logistics managers often pair historical data with predictive analytics to strengthen long-term supply chain planning.
What Are the Benefits of Tracking Freight Index Trends?
Monitoring china containerized freight index historical data provides several advantages:
| Benefit | Description | Example |
|---|---|---|
| Cost Control | Identify periods of lower freight rates to ship more | Businesses ship bulk cargo during low-rate months |
| Risk Management | Avoid shipping during peak congestion periods | Importers delay shipments to prevent delays |
| Market Forecasting | Predict future shipping trends | Retailers adjust orders before holiday demand spikes |
| Contract Negotiation | Gain leverage in freight agreements | Exporters secure multi-year contracts at stable rates |
Therefore, companies that track historical freight index trends gain a competitive edge in global trade.
Case Study: How an Importer Saved Costs Using Historical Freight Data

A mid-sized U.S. furniture importer relied heavily on shipments from Shanghai to Los Angeles. In 2021, when freight rates surged above $15,000 per container, the company faced severe cost pressure. By analyzing china containerized freight index historical data, the logistics team realized that rates traditionally eased during the post-holiday period (February–March).
They delayed non-urgent shipments by six weeks and signed a partial fixed-rate contract with their freight forwarder. As a result, they saved approximately 18% on total logistics expenses. This case highlights how historical data is not just theoretical but a practical decision-making tool for real-world business scenarios.
How Does CCFI Compare with Other Freight Indices?
There are multiple freight indices available in the shipping industry. Below is a comparison:
| Index | Coverage | Basis of Calculation | Usage |
|---|---|---|---|
| CCFI (China Containerized Freight Index) | Major routes from China | Contract + spot rates | Benchmark for Chinese exports |
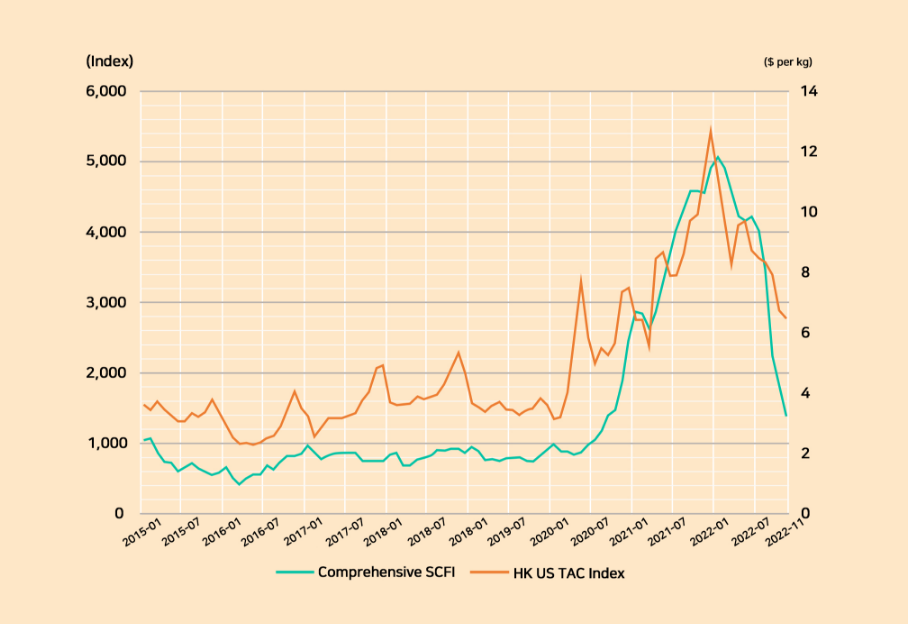
| SCFI (Shanghai Containerized Freight Index) | Shanghai routes only | Spot market rates | Short-term spot analysis |
| BDI (Baltic Dry Index) | Bulk commodities (not containers) | Charter rates | Bulk shipping benchmark |
This comparison shows that while SCFI and BDI serve niche purposes, china containerized freight index historical data is most relevant for containerized exports from China.
What Are the Challenges of Using Historical Freight Data?
Past performance does not always predict future rates.
Data might not reflect specific niche trade lanes.
Pandemics, wars, or political conflicts can disrupt patterns.
Individual contracts may differ from index averages.
Should Shippers Combine CCFI with Other Logistics Insights?
Yes. To get a full picture of global shipping trends, shippers should integrate:
- Port performance reports
- Customs clearance times
- Delivery schedules by trade lane
- Inventory management cycles
By combining multiple data sources, logistics managers gain deeper insight beyond china containerized freight index historical data, allowing them to make smarter supply chain decisions.
Conclusion
The china containerized freight index historical data is an essential resource for importers, exporters, and freight forwarders. It provides insights into shipping costs, logistics efficiency, and market volatility. While past data does not guarantee future outcomes, analyzing long-term patterns helps businesses plan strategically, negotiate better contracts, and reduce risks. For companies engaged in global trade, leveraging historical freight data is no longer optional but a necessity for competitive supply chain management.
Need a Shipping Quote?
If you want expert guidance and peace of mind, our team is ready to assist.
TJ China Freight offers tailored solutions to help businesses of all sizes ship more reliably from China.

FAQ
Q1:How often is the China Containerized Freight Index updated?
The CCFI is updated weekly, reflecting both contract and spot freight rates to track shipping cost changes.
Q2:Can small businesses benefit from tracking CCFI historical data?
Yes. It helps small importers and exporters time shipments better and avoid peak freight costs.
Q3:What is the difference between CCFI and SCFI?
CCFI includes contract and spot rates across major Chinese ports, while SCFI only shows spot rates from Shanghai.
Q4:Does CCFI historical data include surcharges like fuel costs?
Yes. It generally reflects total freight costs, including bunker fuel and other surcharges.
Q5:Can historical freight index data predict future shipping rates?
Not exactly. It shows patterns, but external shocks like fuel spikes or port delays can change outcomes.