Importers and exporters increasingly rely on the China Containerized Freight Index (CCFI) to track freight rates and evaluate global shipping trends. This index provides insight into pricing, supply chain fluctuations, and route-specific adjustments. For businesses engaged in international trade, understanding the CCFI helps improve budgeting, shipping decisions, and long-term logistics planning.
What Is the China Containerized Freight Index?
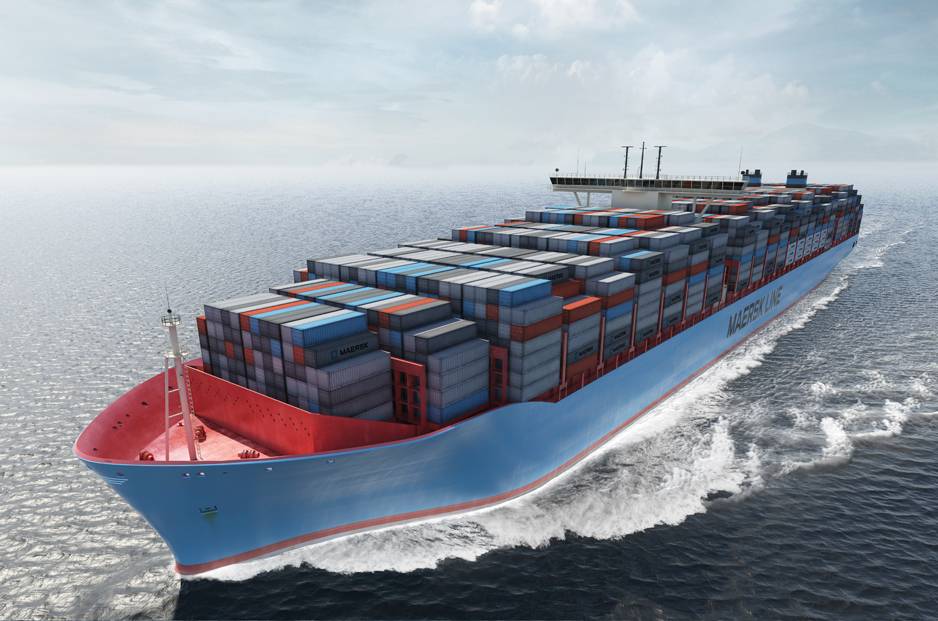
The China Containerized Freight Index measures fluctuations in freight rates for containerized cargo shipped from major Chinese ports. It covers numerous trade lanes including routes to Europe, North America, Southeast Asia, and the Middle East.
The index is calculated weekly and published by the Shanghai Shipping Exchange. Since freight prices directly affect landed costs, the CCFI serves as a benchmark for shippers and logistics professionals worldwide.
Why Does the China Containerized Freight Index Matter?
The CCFI influences both strategic and operational decisions in global trade:
- Budgeting: Provides benchmarks for logistics cost planning.
- Contract negotiations: Assists in forming long-term shipping contracts.
- Market transparency: Offers insight into supply-demand imbalances.
- Risk management: Helps forecast future shipping expenses.
Therefore, importers and exporters use the index to maintain profitability while navigating volatile market conditions.
How Is the China Containerized Freight Index Calculated?
The calculation is based on actual booking rates collected from key shipping companies. The index includes:
- Freight charges
- Bunker adjustment factors
- Terminal handling fees
- Currency adjustments
However, it does not account for inland transportation, insurance, or customs duties, meaning importers should add these when estimating total costs.
Current Trends in the China Containerized Freight Index
Over recent years, the CCFI has shown:
- Significant rate hikes during pandemic disruptions.
- Stabilization as capacity improved in 2023.
- Seasonal fluctuations around Golden Week and Chinese New Year.
- Rising surcharges due to geopolitical tensions and fuel price changes.
Accordingly, logistics managers track weekly updates to align procurement and sales strategies.
Sample Shipping Costs by Route
| Route (POL → POD) | Avg. Rate (per 40HQ) | Transit Time | Notes |
|---|---|---|---|
| Shanghai → Los Angeles | $3,200 – $4,500 | 18–22 days | Rates rose during peak season |
| Ningbo → Hamburg | $2,900 – $4,200 | 28–32 days | Congestion affected schedule reliability |
| Shenzhen → Dubai | $2,600 – $3,800 | 16–20 days | Stable rates, strong Middle East demand |
| Qingdao → Sydney | $2,800 – $4,000 | 14–18 days | Seasonal increases before holidays |
These examples demonstrate how the CCFI reflects both global and regional pricing variations.
What Factors Influence the China Containerized Freight Index?
Several factors shape fluctuations in the index:
- Global demand: Higher import/export volumes push rates upward.
- Carrier capacity: Blank sailings reduce available slots, increasing prices.
- Fuel costs: Bunker price hikes raise shipping expenses.
- Port congestion: Delays at terminals impact both rates and reliability.
- Geopolitics: Trade disputes and sanctions influence market stability.
As a result, businesses must integrate the CCFI into broader supply chain risk assessments.
Real-World Shipping Cases
Case 1: Electronics from Shenzhen to Los Angeles
- Cargo: 40HQ container of consumer electronics
- Mode: Sea freight (FCL)
- Cost: $3,800 based on CCFI data
- Transit Time: 20 days
- Outcome: Retailer adjusted retail pricing to offset rising freight expenses.
Case 2: Apparel from Ningbo to Hamburg
- Cargo: 2 × 20GP containers of clothing
- Mode: Sea freight (LCL consolidated)
- Cost: $6,200 total
- Transit Time: 29 days
- Outcome: Fashion brand managed seasonal delivery despite higher freight index values.
How Does the CCFI Compare with Other Indexes?
| Index | Coverage | Use Case |
|---|---|---|
| China Containerized Freight Index (CCFI) | Rates from Chinese ports | Benchmark for exporters and importers |
| Shanghai Containerized Freight Index (SCFI) | Spot rates from Shanghai | Weekly monitoring of short-term changes |
| Drewry World Container Index (WCI) | Global freight pricing | Long-term contracts and strategy |
While the SCFI emphasizes Shanghai spot rates, the CCFI provides a broader view of multiple trade lanes.
How Can Importers Use the CCFI for Planning?
Importers apply the index to:
- Negotiate fair freight contracts with carriers.
- Forecast annual logistics budgets.
- Identify cost-saving opportunities by comparing modes.
- Manage risk by monitoring weekly index changes.
- Align procurement cycles with seasonal freight adjustments.
Thus, using the index ensures financial predictability in volatile trade conditions.
Air Freight vs. Sea Freight in the Context of the CCFI
Although the CCFI tracks sea freight rates, businesses often compare alternatives.
Comparison
| Factor | Air Freight | Sea Freight (CCFI benchmark) |
|---|---|---|
| Cost | $5–$8 per kg, much higher | $2,500–$4,500 per container |
| Transit Time | 3–7 days | 18–35 days |
| Reliability | High, fixed schedules | Moderate, congestion possible |
| Cargo Type | Small, urgent, high-value goods | Bulky, heavy, less time-sensitive |
Accordingly, some companies adopt multimodal transport, combining speed and cost efficiency.
Conclusion
In summary, the China Containerized Freight Index is a vital benchmark for businesses engaged in global trade. It provides transparency in freight pricing, reflects market trends, and helps companies negotiate, budget, and plan effectively. Although the index does not include all costs, integrating it with customs, inland transport, and insurance estimates offers a complete view of logistics expenses. Ultimately, staying informed about the CCFI ensures smarter shipping decisions and sustained competitiveness in international markets.
- Consult TJ China Freight Forwarding for the lowest quote. They will provide you with reliable, cost-effective service.
FAQs
Q1.How often is the China Containerized Freight Index updated?
The CCFI is published weekly by the Shanghai Shipping Exchange, tracking container freight rates across multiple trade lanes.
Q2.Can the China Containerized Freight Index predict future shipping costs?
No, the CCFI reflects current market conditions but helps businesses forecast trends when combined with demand and fuel price analysis.
Q3.How do importers apply the China Containerized Freight Index?
Importers use it to negotiate contracts, estimate logistics budgets, and manage supply chain risks more effectively.
Q4.What’s the difference between CCFI and SCFI?
The CCFI covers multiple Chinese ports and contract rates, while the SCFI focuses on Shanghai spot rates only.
Q5.How does seasonality impact the China Containerized Freight Index?
Rates often rise before Chinese New Year, Golden Week, and Q4 due to higher export demand and limited vessel space.
